Rapidly rising drug costs have received much attention in recent years, but no clear resolution is in sight for this complex and poorly understood issue, which affects all healthcare consumers and payers.
In workers’ compensation, where prescription drugs are heavily utilized and all costs are covered for the patients, the burden is on employers and insurers to balance high drug prices with providing quality care for injured workers. A task made more challenging by the multiple and shifting factors that affect prescription drug spending.
When drug spending goes up – or down – there are three possible explanations: a change in price, a change in utilization, or a combination of the two. The distinction between cost and price is often overlooked, but it is important because confusing the two terms can lead to erroneous conclusions.
is the total amount of money spent on prescription drugs
is the amount charged for a drug
refers to the incidence of drug use within a population and fluctuates according to the number of patients and drugs taken, as well as duration of therapy
Utilization management is an excellent way to reduce drug costs within certain populations, but drug prices are the common denominator affecting all patients and payers.
The Food and Drug Administration (FDA) was established in 1938, but during the early days of drug research and development the pharmaceutical industry, as we now know it, did not exist. In fact, penicillin, arguably the world’s first blockbuster drug, was not even patented before it became widely available during World War II. Nor was it easy to manufacture and distribute.
But the 1950’s brought improved mechanization and efficiencies, along with some notable scientific advances (not the least of which was determining the structure of DNA) and the modern pharmaceutical industry was born.
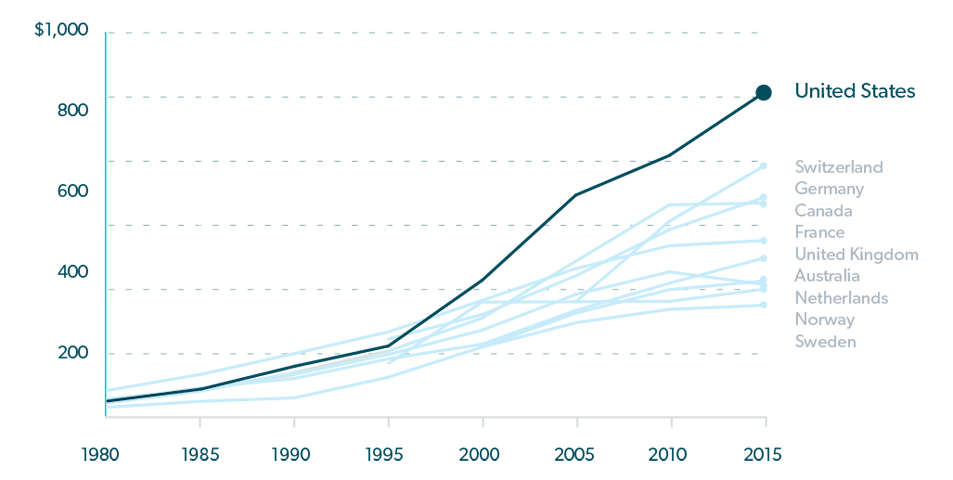
Official expenditure tracking soon followed, and from 1960 until 1980, prescription drug costs in the U.S. increased at a moderate pace, with prices comparable to those in other wealthy nations. But that began to change in the early 1980’s and by the mid 1990’s, prescription drug costs began to soar. 1
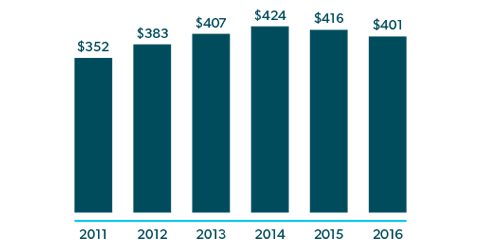
(In Billions U.S Dollars)
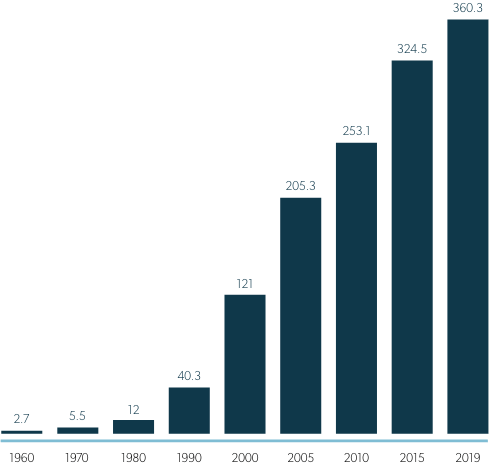
One obvious reason for increasing expenditures during this time was that more drugs were being produced to treat more diseases. However, from 1987 to 1993, about one-half of the annual increase in U.S. prescription drug spending was due to higher prices,4 despite a flood of less expensive generics coming to market after the passage of Hatch-Waxman Act in 1984, which made it easier for generic manufacturers to obtain FDA approval, while also extending protections for brand drugs.5 And in 1995, U.S. drug costs began to rise much more rapidly than costs in peer countries,3 contributing to 10% annual spending increases from 1997 – 2007, tripling the total of real spending on prescription drugs in just 10 years.6
Several factors were in play here. A combination of scientific innovation and federal legislation that provided protections and incentives to drug manufacturers7 resulted in a glut of drugs coming to market. Some were generics, but others were brand new – and costly – drugs for the treatment of high-demand conditions such as hypertension, high cholesterol and cancer. OxyContin also made its debut in 1995, kicking off aggressive sales of opioids for pain relief. In addition, consumer advertising increased, FDA approvals came faster, and coverage for prescription drugs from government insurance programs expanded.
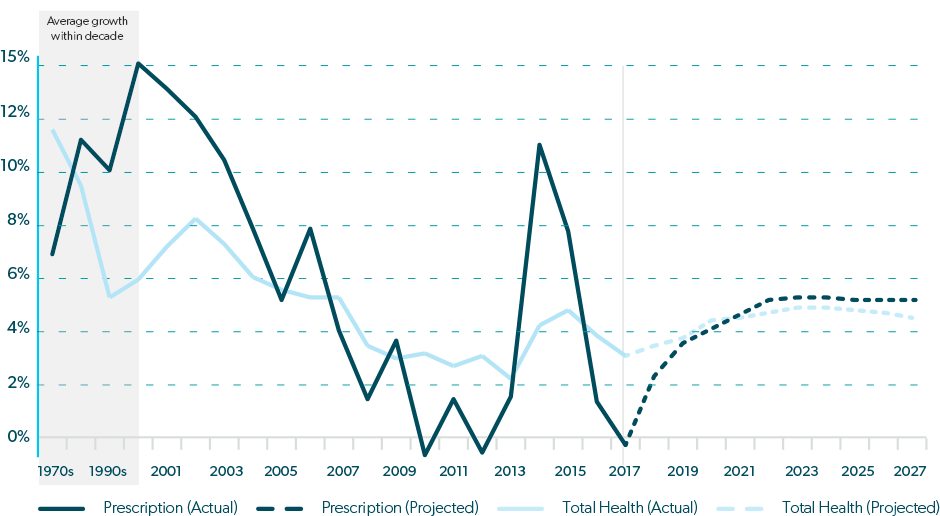
By 2007, fewer new drugs were entering the market and patents for some blockbuster drugs expired, so cost increases slowed considerably. Except for a slight deviation in 2009, growth in drug spending remained below 2% until 2013.
In 2014, U.S. drug costs grew a whopping 12%,7 precipitating record spending of $457 billion on prescription drugs in 2015, or 17% of overall health care services.3 Similar to what happened in the 1990’s, this surge followed the entrance of some new and expensive drugs to the market.
Any new drug can drive up costs in two ways – by the price it commands and by increasing overall drug utilization. For the period between 2010 and 2014, the Department of Health and Human Services estimates that 30% of the increase in drug expenditures was due to more per-person prescriptions, or greater utilization, and another 30% was due to new drugs or price increases for existing drugs.8
Notably, a number of specialty drugs and biologics entered the market during this period. Biologics are drugs that are derived from living cells. Specialty drugs are often, but not always, used to treat rare or complex diseases and they are usually quite expensive.
Used to treat rare and/or complex chronic conditions
Difficult or unusual delivery process to the patient (e.g., injectable, infused, inhaled)
Special handling or storage
Often, but not always, biologics
High cost
Specialty drugs are used by an average of only 2‐3% of the population, but their cost can account for one third to one half of prescription drug spend.9 In workers’ comp, specialty conditions have traditionally represented a small minority of the injured worker population, but that is likely to grow as more of these drugs are developed and more conditions are covered. Currently, specialty and biologic drugs are used in workers’ comp to treat HIV and hepatitis C, pulmonary fibrosis, inflammatory and cardiovascular conditions, various cancers, and more.
See “6 Specialty Drug Trends Impacting Workers’ Comp Right Now” in the RxInformer Winter 2017 edition.
The combination of increased drug utilization, expensive new drugs, and regular price increases led to drug cost increases that significantly outpaced growth in total healthcare spending between 2013 and 2016, raising alarm and ushering in the current climate of intense scrutiny on drug prices.

Allowing that price is only one side of the cost equation, drug prices do matter and there is no question that they continue to rise. From 2008 – 2016, annual drug price increases averaged 12% for brandname drugs, 16% for specialty drugs, and 6% for generic drugs. The price increases for specialty and generic drugs were largely attributed to new drugs entering the market, but the higher pricing on brand drugs was due to existing drug price inflation.7
And the rising price trend for all drugs continues. During the first half of 2019, prices were raised on 3,400 existing drugs, with an average price hike of 10.5%, or five times the rate of inflation. Over 40 of these drug prices increased by more than 100%.7

Prescription drug spending now accounts for approximately 17% of total U.S. healthcare spending.3 This proportion has increased over the past decade, but it should be noted that U.S. spending on drugs as a percentage of total healthcare costs is similar to other nations, mainly because of similar increases in costs for other healthcare products and services.1
There is no single answer as to why drug prices keep escalating. The pharmacy and healthcare industries are complex and intertwined, making it difficult to isolate a single – or even just a few – reasons for drug price inflation. A recent report from The Commonwealth Fund cites 10 major problems that contribute to high drug prices:3
The pharmacy distribution rebate/discount system has recently been under fire as a potentially large contributor to high drug prices, but a study by Bloomberg analysts showed that even after rebates and discounts, U.S. drug prices are still significantly higher than those in other countries.11
The intricacies of our healthcare and pharmacy systems suggest that many factors contribute to the high cost of prescription drugs, which is why there are so many proposed solutions.
Drug prices have become a priority for many Americans and 63% of voters recently surveyed agreed that more regulation is needed.12 This has prompted a growing political will to tackle the issue.
Several bills to rein in escalating drug prices have been proposed by federal lawmakers and administrators, including:
To date, none of the proposed federal legislation has been signed into law. As of this writing, a new bill was proposed in Congress, which would allow the Department of Health and Human Services (HHS) secretary to negotiate prices on 250 drugs per year, prioritizing the most expensive brand‐name drugs, and several other proposals from both sides of the aisle are still viable.
Many states have enacted bills intended to help lower drug costs. As of August 1, 2019, 47 states had filed 272 bills to control drug costs and 51 bills were enacted in 33 states.13 New laws pertain to actions such as allowing the importation of prescription drugs, monitoring drug prices for large price increases, and setting prices that states will pay for drugs.
When drug prices rise, they rise for everyone, including workers’ comp payers. The most commonly prescribed drug types in workers’ comp are analgesics – opioids, anticonvulsants, and muscle relaxants. From 2015 to 2018, the average price increase for the most commonly prescribed opioids was 33%. Muscle relaxant prices also increased by approximately 33% during the same period, while anti‐inflammatory prices increased over 22%. And some highly prescribed dermatologicals, also used to relieve pain, such as Lidoderm and Flector, saw price increases averaging 52% between 2015 and 2018.14
However, in spite of higher drug prices, drug costs have been decreasing in workers’ comp. Pharmacy spending declined 31.5% from 2009‐2017.15 In 2015 and 2016, prescription drug costs per active claim deceased by 2% and 4% respectively, while prices for drugs commonly used in workers’ comp went up by 8% and 5%. The higher prices were offset by even higher utilization declines of 9% in 2015 and 8% in 2016.16
Lower drug costs in workers’ comp have been realized through the successful efforts between payers and their PBMs in reducing opioid use and physician dispensing, and achieving high rates of brand‐to‐generic conversions and in‐network transactions.
Drug prices are still too high by any measure. But the recent cost reductions in workers’ comp demonstrate that effective drug utilization management and constructive clinical oversight can soften the impact and realize savings for payers, while still providing quality care for patients.